ECONOMIC DEVELOPMENT IN THE WORLD
Summary
This chapter outlines how businesses and economists evaluate world economies. Then, the remaining sections review what developed and developing worlds are and how they differ, as well as explain how to evaluate the expanding set of emerging-market countries, which started with the BRIC countries (i.e., Brazil, Russia, India, and China) and has now expanded to include twenty-eight countries. Effective global managers need to be able to identify the markets that offer the best opportunities for their products and services. Additionally, managers need to monitor these emerging markets for new local companies that take advantage of business conditions to become global competitors.
Countries can be categorized in terms of their stage of economic development: low income, lower middle income, upper middle income, and high income. Gross domestic product (GDP) and gross national income (GNI) are commonly used measures of economic development. The 50 poorest countries in the low-income category are sometimes referred to as least-developed countries (LDCs). Upper middle-income countries with high growth are often called newly industrializing economies (NIEs). Several of the world’s economies are notable for their fast growth; the BRIC nations include Brazil, Russia, India, and China. The Group of Seven (G7), Group of Eight (G-8), and Organization for Economic Cooperation and Development (OECD) represent efforts by high-income nations to promote democratic ideals and free-market policies throughout the rest of the world. Most of the world’s income is located in the Triad, which is comprised of Japan, the United States, and Western Europe. Companies with global aspirations generally have operations in all three areas. Market potential for a product can be evaluated by determining product saturation levels in light of income levels.
WORLD ECONOMIES
After reading this section, students should be able to …
- Understand the unique strengths as well as many similarities among the two major economies – China and India
When global marketing managers explore how to expand, they start by looking at the world. Knowing the major markets and the stage of development for each allows managers to determine how best to enter and expand. The manager’s goal is to hone in on a new country—hopefully, before their competitors and usually before the popular media does. China and India were expanding rapidly for several years before the financial press, such as the Wall Street Journal, elevated them to their current hot status.
It’s common to find people interested in doing business with a country simply because they’ve read that it’s the new “hot” economy. They may know little or nothing about the market or country—its history, evolution of thought, people, or how interactions are generally managed in a business or social context. Historically, many companies have only looked at new global markets once potential customers or partners have approached them. However, trade barriers are falling, and new opportunities are fast emerging in markets of the Middle East and Africa—further flattening the world for global firms. Companies are increasingly identifying these and other global markets for their products and services and incorporating them into their long-term growth strategies.
Opening Case
China versus India: Who Will Win??
India and China are among the world’s fastest-growing economies, contributing nearly 30 percent to global economic growth. Both China and India are not emerging economies—they’re actually “re-emerging,” having spent centuries at the center of trade throughout history: “These two Asian giants, which until 1800 used to make up half the world economy, are not, like Japan and Germany, mere nation states. In terms of size and population, each is a continent—and for all the glittering growth rates, a poor one.”1
Both India and China are in fierce competition with each other as well as in their quest to catch up with the major economies in the developed world. Each have particular strengths and competitive advantages that have allowed each of them to weather the recent global financial crisis better than most countries. China’s growth has been mainly investment and export driven, focusing on low-cost manufacturing, with domestic consumption as low as 36 percent of gross domestic product (GDP). On the other hand, India’s growth has been derived mostly from a strong services sector and buoyant domestic consumption. India is also much less dependent on trade than China, relying on external trade for about 20 percent of its GDP versus 56 percent for China. The Chinese economy has doubled every eight years for the last three decades—the fastest rate for a major economy in recorded history. By 2011, China is the world’s second largest economy in the world behind the United States.2 A recent report by PricewaterhouseCoopers forecasts that China could overtake the US economy as early as 2020.3
China is also the first country in the world to have met the poverty-reduction target set in the UN Millennium Development Goals and has had remarkable success in lifting more than 400 million people out of poverty. This contrasts sharply with India, where 456 million people (i.e., 42 percent of the population) still live below the poverty line, as defined by the World Bank at $1.25 a day.4
China has made greater strides in improving the conditions for its people, as measured by the HDI. All of this contributes to the local business conditions by both developing the skill sets of the workforce as well as expanding the number of middle-class consumers and their disposable incomes.
India has emerged as the fourth-largest market in the world when its GDP is measured on the scale of purchasing power parity. Both economies are increasing their share of world GDP, attracting high levels of foreign investment, and are recovering faster from the global crisis than developed countries. “Each country has achieved this with distinctly different approaches—India with a ‘grow first, build later’ approach versus a ‘top-down, supply driven’ strategy in China.”5
The Chinese economy historically outpaces India’s by just about every measure. China’s fast-acting government implements new policies with blinding speed, making India’s fractured political system appear sluggish and chaotic. Beijing’s shiny new airport and wide freeways are models of modern development, contrasting sharply with the sagging infrastructure of New Delhi and Mumbai. And as the global economy emerges from the Great Recession, India once again seems to be playing second fiddle. Pundits around the world laud China’s leadership for its well-devised economic policies during the crisis, which were so effective in restarting economic growth that they helped lift the entire Asian region out of the downturn.6
As recently as the early 1990s, India was as rich, in terms of national income per head. China then hurtled so far ahead that it seemed India could never catch up. But India’s long-term prospects now look stronger. While China is about to see its working-age population shrink, India is enjoying the sort of bulge in manpower which brought sustained booms elsewhere in Asia. It is no longer inconceivable that its growth could outpace China’s for a considerable time. It has the advantage of democracy—at least as a pressure valve for discontent. And India’s army is, in numbers, second only to China’s and America’s…And because India does not threaten the West, it has powerful friends both on its own merits and as a counterweight to China.7
India’s domestic economy provides greater cushion from external shocks than China’s. Private domestic consumption accounts for 57 percent of GDP in India compared with only 35 percent in China. India’s confident consumer didn’t let the economy down. Passenger car sales in India in December jumped 40 percent from a year earlier.8
Since 1978, China’s economic growth and reform have dramatically improved the lives of hundreds of millions of Chinese, increased social mobility. The Chinese leadership has reduced the role of ideology in economic policy by adopting a more pragmatic perspective on many political and socioeconomic problems. China’s ongoing economic transformation has had a profound impact not only on China but on the world. The market-oriented reforms China has implemented over the past two decades have unleashed individual initiative and entrepreneurship. The result has been the largest reduction of poverty and one of the fastest increases in income levels ever seen.
China used to be the third-largest economy in the world but has overtaken Japan to become the second-largest in August 2010. It has sustained average economic growth of over 9.5 percent for the past 26 years. In 2009 its $4.814 trillion economy was about one-third the size of the United States economy.9 China leapfrogged over Japan and became the world’s number two economy in the second quarter of 2010, as receding global growth sapped momentum and stunted a shaky recovery.
India’s economic liberalization in 1991 opened gates to businesses worldwide. In the mid- to late 1980s, Rajiv Gandhi’s government eased restrictions on capacity expansion, removed price controls, and reduced corporate taxes. While his government viewed liberalizing the economy as a positive step, political pressures slowed the implementation of policies. The early reforms increased the rate of growth but also led to high fiscal deficits and a worsening current account. India’s major trading partner then, the Soviet Union, collapsed. In addition, the first Gulf War in 1991 caused oil prices to increase, which in turn led to a major balance-of-payments crisis for India. To be able to cope with these problems, the newly elected Prime Minister Narasimha Rao along with Finance Minister Manmohan Singh initiated a widespread economic liberalization in 1991 that is widely credited with what has led to the Indian economic engine of today. Focusing on the barriers for private sector investment and growth, the reforms enabled faster approvals and began to dismantle the License Raj, a term dating back to India’s colonial historical administrative legacy from the British and referring to a complex system of regulations governing Indian businesses.10
Since 1990, India has been emerging as one of the wealthiest economies in the developing world. Its economic progress has been accompanied by increases in life expectancy, literacy rates, and food security. Goldman Sachs predicts that India’s GDP in current prices will overtake France and Italy by 2020; Germany, the United Kingdom, and Russia by 2025; and Japan by 2035 to become the third-largest economy of the world after the United States and China. India was cruising at 9.4 percent growth rate until the financial crisis of 2008–9, which affected countries the world over.11 Both India and China have several strengths and weaknesses that contribute to the competitive battleground between them.
China’s Strengths
- Strong government control. China’s leadership has a development-oriented ideology, the ability to promote capable individuals, and a system of collaborative policy review. The strong central government control has enabled the country to experience consistent and managed economic success. The government directs economic policy and its implementation and is less susceptible than democratic India to sudden changes resulting from political pressures.
- WTO and FDI. China’s entry into the World Trade Organization (WTO) and its foreign direct investment (FDI) in other global markets has been an important factor in the country’s successful growth. Global businesses also find the consistency and predictability of the Chinese government a plus when evaluating direct investment.
- Cheap, abundant labor. China’s huge population offers large pools of skilled and unskilled workers, with fewer labor regulations than in India.
- Infrastructure. The government has prioritized the development of the country’s infrastructure including roads and highways, ports, airports, telecommunications networks, education, public health, law and order, mass transportation, and water and sewer treatment facilities.
- Effectiveness of two-pronged financial system. “The first prong is a well-run directed-credit system that channels funds from bank and postal deposits to policy-determined public uses; the second is a profit-oriented and competitive system, albeit in early and inefficient stages of development. Both prongs continue to undergo rapid government-sponsored reforms to make them more effective.”12
India’s Strengths
Infosys is one of India’s new wave of world-class IT companies.

Image courtesy of Infosys.
- Quality manpower. India has a technologically competent, English-speaking workforce. As a major exporter of technical workers, India has prioritized the development of its technology and outsourcing sectors. India is the global leader in the business process outsourcing (BPO) and call-center services industries.
- Open democracy. India’s democratic traditions are ingrained in its social and cultural fabric. While the political process can at times be tumultuous, it is less likely than China to experience big uncertainties or sudden revolutionary changes as those recently witnessed in the Middle East in late 2010 and early 2011.
- Entrepreneurship. India entrepreneurial culture has led to global leaders, such as the Infosys cofounder, Narayana Murthy. Utilizing the global network of Indians in business and Indian business school graduates, India has an additional advantage over China in terms of entrepreneurship-oriented bodies, such as the TiE network (The Indus Entrepreneurs) or the Wadhwani Foundation, which seek to promote entrepreneurship by, among other things, facilitating investments.13
- Reverse brain drain. Historically many emerging and developing markets experienced what is known as brain drain—where its best young people, once educated, moved to developed countries to access better jobs, incomes, and prospects for career advancement. In the past decade, economists have observed that the fast-growing economies of China and India are experiencing the reverse. Young graduates are remaining in India and China to pursue dynamic domestic opportunities. In fact, older professionals are returning from developed countries to seek their fortunes and career advancements in the promising local economies—hence the term reverse brain drain. The average age of the Indian returnees is thirty years old, and these adults are well educated—66 percent hold a master’s degree, while 12 percent hold PhDs. The majority of these degrees are in management, technology, and science. Indians returning home are encouraged by the increasing transparency in business and government as well as the political freedoms and the prospects for economic growth.14
- Indian domestic-market growth. According to the Trade and Development Report 2010, for sustainable growth, policies “should be based on establishing a balanced mix of domestic and overseas demand.”15 Each country has embraced the trend toward urbanization differently. Global businesses are impacted in the way cities are run:
China is in much better shape than India is. While India has barely paid attention to its urban transformation, China has developed a set of internally consistent practices across every element of the urbanization operating model: funding, governance, planning, sectorial policies, and shape. India has underinvested in its cities; China has invested ahead of demand and given its cities the freedom to raise substantial investment resources by monetizing land assets and retaining a 25 percent share of value-added taxes. While India spends $17 per capita in capital investments in urban infrastructure annually, China spends $116. Indian cities have devolved little real power and accountability to its cities; but China’s major cities enjoy the same status as provinces and have powerful and empowered political appointees as mayors. While India’s urban planning system has failed to address competing demands for space, China has a mature urban planning regime that emphasizes the systematic development of run-down areas consistent with long-range plans for land use, housing, and transportation.16
Despite the urbanization challenges, India is likely to benefit in the future from its younger demographics: “By 2025, nearly 28 percent of China’s population will be aged 55 or older compared with only 16 percent in India.”17 The trend toward urbanization is evident in both countries. By 2025, 64 percent of China’s population will be living in urban areas, and 37 percent of India’s people will be living in cities.18 This historically unique trend offers global businesses exciting markets.
So what markets are likely to benefit the most from these trends? In India, by 2025, the largest markets will be transportation and communication, food, and health care followed by housing and utilities, recreation, and education. Even India’s slower-growing spending categories will represent significant opportunities for businesses because these markets will still be growing rapidly in comparison with their counterparts in other parts of the world. In China’s cities today, the fastest-growing categories are likely to be transportation and communication, housing and utilities, personal products, health care, and recreation and education. In addition, in both China and India, urban infrastructure markets will be massive.19
While both India and China have unique strengths as well as many similarities, it’s clear that both countries will continue to grow in the coming decades offering global businesses exciting new domestic markets.
CLASSIFYING WORLD ECONOMIES
After reading this section, students should be able to …
- Understand how economies are classified.
- Evaluate the statistics used in classifications: GNP, GDP, PPP as well as HDI, HPI, GDI, and GEM.
Classification of Economies
Experts debate exactly how to define the level of economic development of a country—which criteria to use and, therefore, which countries are truly developed. This debate crosses political, economic, and social arguments.
When evaluating a country, a manager is assessing the country’s income and the purchasing power of its people; the legal, regulatory, and commercial infrastructure, including communication, transportation, and energy; and the overall sophistication of the business environment.
Why does a country’s stage of development matter? Well, if you’re selling high-end luxury items, for example, you’ll want to focus on the per capita income of the local citizens. Can they afford a $1,000 designer handbag, a luxury car, or cutting-edge, high-tech gadgets? If so, how many people can afford these expensive items (i.e., how large is the domestic market)? For example, in January 2011, the Financial Times quotes Jim O’Neill, a leading business economist, who states, “South Africa currently accounts for 0.6 percent of world GDP. South Africa can be successful, but it won’t be big.”1 But clearly the size of the local market is an important key factor for businesspeople.
Even in developing countries, there are always wealthy people who want and can afford luxury items. But these consumers are just as likely to head to the developed world to make their purchase and have little concern about any duties or taxes they may have to pay when bringing the items back into their home country. This is one reason why companies pay special attention to understanding their global consumers as well as where and how these consumers purchase goods. Global managers also focus on understanding if a country’s target market is growing and by what rate. Countries like China and India caught the attention of global companies, because they had large populations that were eager for foreign goods and services but couldn’t afford them. As more people in each country acquired wealth, their buying appetites increased. The challenge is how to identify which consumers in which countries are likely to become new customers. Managers focus on globally standard statistics as one set of criteria to understand the stage of development of any country that they’re exploring for business.2
Let’s look more closely at some of these globally standard statistics and classifications that are commonly used to define the stage of a country’s development.
Statistics Used in Classifications
Gross Domestic Product
Gross domestic product (GDP) is the value of all the goods and services produced by a country in a single year. Usually quoted in US dollars, the number is an official accounting of the country’s output of goods and services. For example, if a country has a large black, or underground, market for transactions, it will not be included in the official GDP. Emerging-market countries, such as India and Russia, historically have had large black-market transactions for varying reasons, which often meant their GDP was underestimated.
Figure 5.1
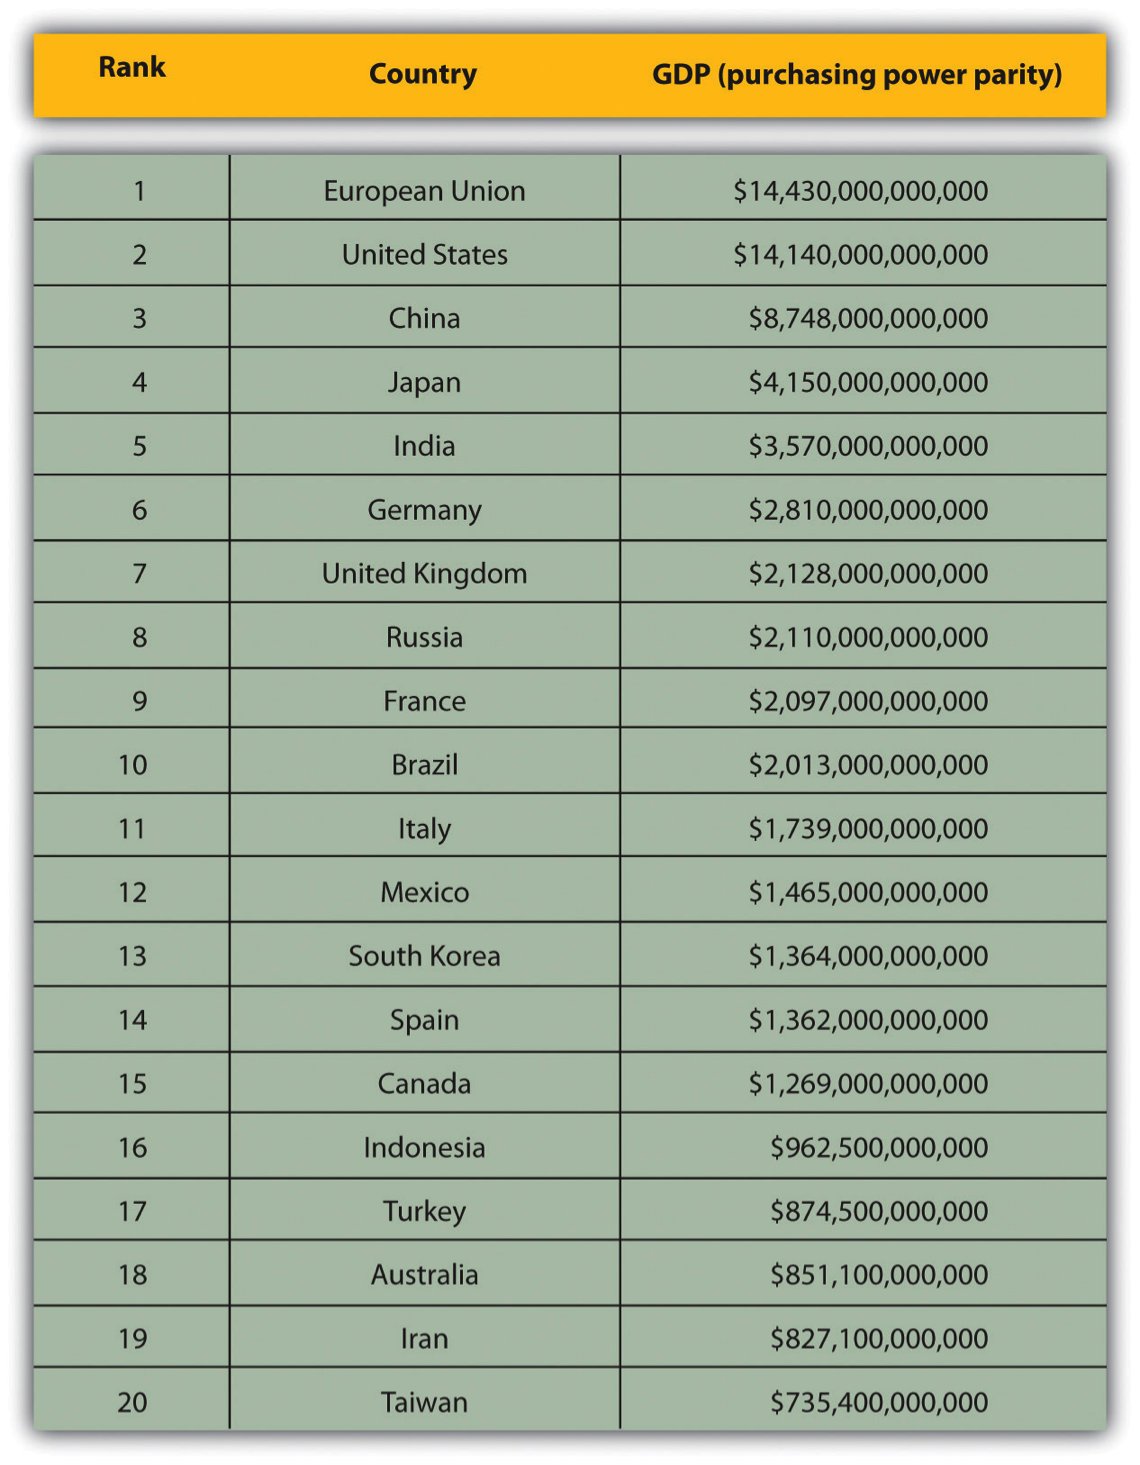
Source: US Central Intelligence Agency, “Country Comparison: GDP (PPP),” World Factbook, accessed June 3, 2011, https://www.cia.gov/library/publications/the-world-factbook/rankorder/2001rank.html.
Figure 5.1 shows the total size of the economy, but a company will want to know the income per person, which may be a better indicator of the strength of the local economy and the market opportunity for a new consumer product. GDP is often quoted on a per person basis. Per capita GDP is simply the GDP divided by the population of the country.
The per capita GDP can be misleading because actual costs in each country differ. As a result, more managers rely on the GDP per person adjusted for purchasing power to understand how much income local residents have. This number helps professionals evaluate what consumers in the local market can afford.
Companies selling expensive goods and services may be less interested in economies with low per capita GDP. Figure 5.2 “Per Capita GDP on a Purchasing Power Parity Basis” shows the income (GDP) on a per person basis. For space, the chart has been condensed by removing lower profile countries, but the ranks are valid. Surprisingly, some of the hottest emerging-market countries—China, India, Turkey, Brazil, South Africa, and Mexico—rank very low on the income per person charts. So, why are these markets so exciting? One reason might be that companies selling cheaper, daily-use items, such as soap, shampoos, and low-end cosmetics, have found success entering developing, but promising, markets.
Figure 5.2 Per Capita GDP on a Purchasing Power Parity Basis
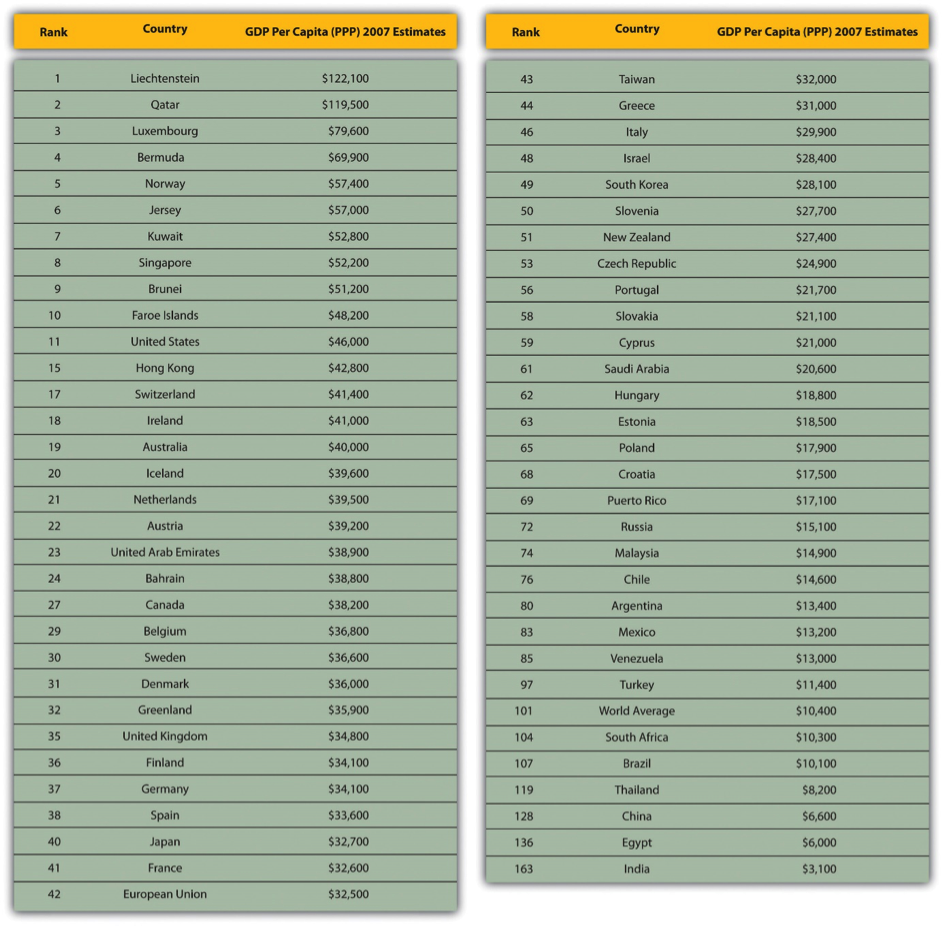
Source: US Central Intelligence Agency, “Country Comparison: GDP—Per Capita (PPP),” World Factbook, accessed June 3, 2011, https://www.cia.gov/library/publications/the-world-factbook/rankorder/2004rank.html.
Purchasing Power Parity
To compare production and income across countries, we need to look at more than just GDP. Economists seek to adjust this number to reflect the different costs of living in specific countries. Purchasing power parity (PPP) is, in essence, an economic theory that adjusts the exchange rate between countries to ensure that a good is purchased for the same price in the same currency. For example, a basic cup of coffee should cost the same in London as in New York.
A nation’s GDP at purchasing power parity (PPP) exchange rates is the sum value of all goods and services produced in the country valued at prices prevailing in the United States. This is the measure most economists prefer when looking at per-capita welfare and when comparing living conditions or use of resources across countries. The measure is difficult to compute, as a US dollar value has to be assigned to all goods and services in the country regardless of whether these goods and services have a direct equivalent in the United States (for example, the value of an ox-cart or non-US military equipment); as a result, PPP estimates for some countries are based on a small and sometimes different set of goods and services. In addition, many countries do not formally participate in the World Bank’s PPP project to calculate these measures, so the resulting GDP estimates for these countries may lack precision. For many developing countries, PPP-based GDP measures are multiples of the official exchange rate (OER) measure. The differences between the OER- and PPP-denominated GDP values for most of the wealthy industrialized countries are generally much smaller.3
In some countries, like Germany, the United Kingdom, or Japan, the cost of living is quite high and the per capita GDP (nominal) is higher than the GDP adjusted for purchasing power. Conversely, in countries like Mexico, Brazil, China, and India, the per capita GDP adjusted for purchasing power is higher than the nominal per capita GDP, implying that local consumers in each country can afford more with their incomes.
Figure 5.3 Per Capita GDP (Nominal) versus Per Capita GDP (PPP) of Select Countries (2010)
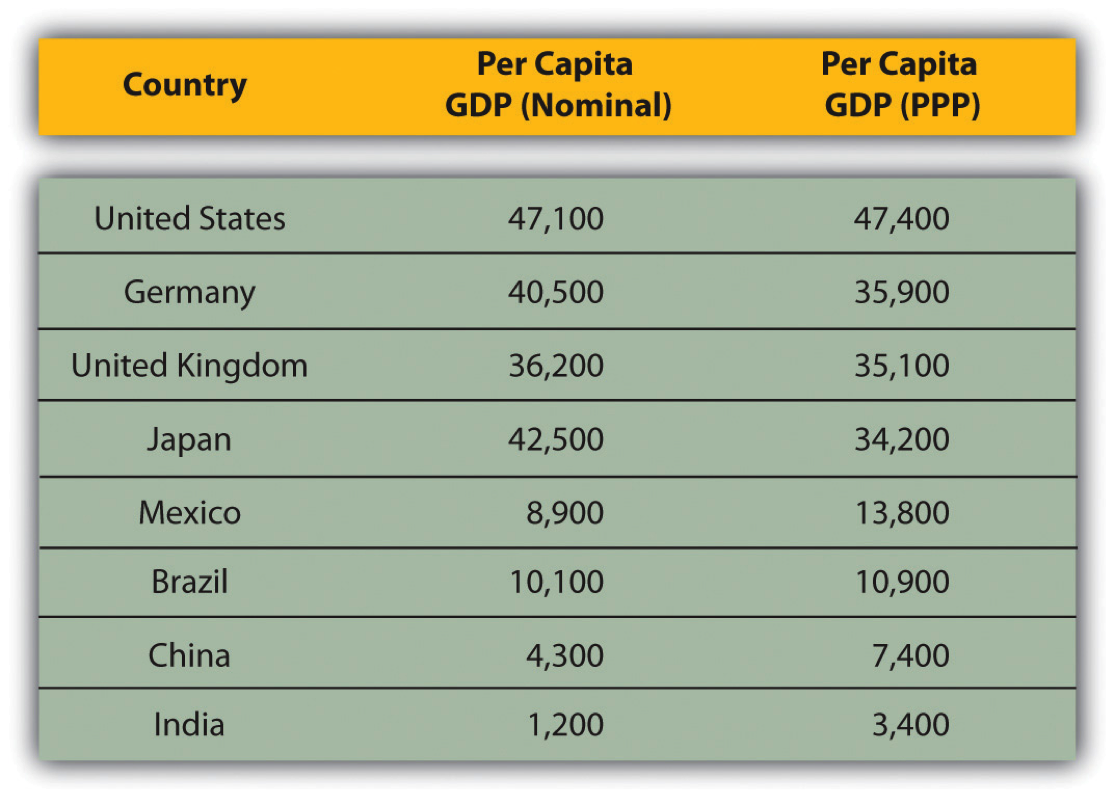
Sources: “List of Countries by GDP (Nominal) Per Capita,” Wikipedia, http://en.wikipedia.org/wiki/List_of_countries_by_GDP_(nominal)_per_capita. “Country Comparison: GDP—Per Capita (PPP),” US Central Intelligence Agency, https://www.cia.gov/library/publications/the-world-factbook/rankorder/2004rank.html.
Human Development Index (HDI)
GDP and purchasing power provide indications of a country’s level of economic development by using an income-focused statistic. However, in recent years, economists and business analysts have focused on indicators that measure whether people’s needs are satisfied and whether the needs are equally met across the local population. One such indication is the human development index (HDI), which measures people’s satisfaction in three key areas—long and healthy life in terms of life expectancy; access to quality education equally; and a decent, livable standard of living in the form of income.
Since 1990, the United Nations Development Program (UNDP) has produced an annual report listing the HDI for countries. The HDI is a summary composite index that measures a country’s average achievements in three basic aspects of human development: health, knowledge, and a decent standard of living. Health is measured by life expectancy at birth; knowledge is measured by a combination of the adult literacy rate and the combined primary, secondary, and tertiary gross enrollment ratio; and standard of living by (income as measured by) GDP per capita (PPP US$).4
While the HDI is not a complete indicator of a country’s level of development, it does help provide a more comprehensive picture than just looking at the GDP. The HDI, for example, does not reflect political participation or gender inequalities. The HDI and the other composite indices can only offer a broad proxy on some of the key the issues of human development, gender disparity, and human poverty.5 Table 5.1 “Human Development Index (HDI)—2010 Rankings” shows the rankings of the world’s countries for the HDI for 2010 rankings. Measures such as the HDI and its components allow global managers to more accurately gauge the local market.
Table 5.1 Human Development Index (HDI)—2010 Rankings
| Very High Human Development | High Human Development | Medium Human Development | Low Human Development |
| 1. Norway | 43. Bahamas | 86. Fiji | 128. Kenya |
| 2. Australia | 44. Lithuania | 87. Turkmenistan | 129. Bangladesh |
| 3. New Zealand | 45. Chile | 88. Dominican Republic | 130. Ghana |
| 4. United States | 46. Argentina | 89. China | 131. Cameroon |
| 5. Ireland | 47. Kuwait | 90. El Salvador | 132. Myanmar |
| 6. Liechtenstein | 48. Latvia | 91. Sri Lanka | 133. Yemen |
| 7. Netherlands | 49. Montenegro | 92. Thailand | 134. Benin |
| 8. Canada | 50. Romania | 93. Gabon | 135. Madagascar |
| 9. Sweden | 51. Croatia | 94. Suriname | 136. Mauritania |
| 10. Germany | 52. Uruguay | 95. Bolivia (Plurinational State of) | 137. Papua New Guinea |
| 11. Japan | 53. Libyan Arab Jamahiriya | 96. Paraguay | 138. Nepal |
| 12. Korea (Republic of) | 54. Panama | 97. The Philippines | 139. Togo |
| 13. Switzerland | 55. Saudi Arabia | 98. Botswana | 140. Comoros |
| 14. France | 56. Mexico | 99. Moldova (Republic of) | 141. Lesotho |
| 15. Israel | 57. Malaysia | 100. Mongolia | 142. Nigeria |
| 16. Finland | 58. Bulgaria | 101. Egypt | 143. Uganda |
| 17. Iceland | 59. Trinidad and Tobago | 102. Uzbekistan | 144. Senegal |
| 18. Belgium | 60. Serbia | 103. Micronesia (Federated States of) | 145. Haiti |
| 19. Denmark | 61. Belarus | 104. Guyana | 146. Angola |
| 20. Spain | 62. Costa Rica | 105. Namibia | 147. Djibouti |
| 21. Hong Kong, China (SAR) | 63. Peru | 106. Honduras | 148. Tanzania (United Republic of) |
| 22. Greece | 64. Albania | 107. Maldives | 149. Côte d’Ivoire |
| 23. Italy | 65. Russian Federation | 108. Indonesia | 150. Zambia |
| 24. Luxembourg | 66. Kazakhstan | 109. Kyrgyzstan | 151. Gambia |
| 25. Austria | 67. Azerbaijan | 110. South Africa | 152. Rwanda |
| 26. United Kingdom | 68. Bosnia and Herzegovina | 111. Syrian Arab Republic | 153. Malawi |
| 27. Singapore | 69. Ukraine | 112. Tajikistan | 154. Sudan |
| 28. Czech Republic | 70. Iran (Islamic Republic of) | 113. Vietnam | 155. Afghanistan |
| 29. Slovenia | 71. The former Yugoslav Republic of Macedonia | 114. Morocco | 156. Guinea |
| 30. Andorra | 72. Mauritius | 115. Nicaragua | 157. Ethiopia |
| 31. Slovakia | 73. Brazil | 116. Guatemala | 158. Sierra Leone |
| 32. United Arab Emirates | 74. Georgia | 117. Equatorial Guinea | 159. Central African Republic |
| 33. Malta | 75. Venezuela (Bolivarian Republic of) | 118. Cape Verde | 160. Mali |
| 34. Estonia | 76. Armenia | 119. India | 161. Burkina Faso |
| 35. Cyprus | 77. Ecuador | 120. Timor-Leste | 162. Liberia |
| 36. Hungary | 78. Belize | 121. Swaziland | 163. Chad |
| 37. Brunei Darussalam | 79. Colombia | 122. Lao People’s Democratic Republic | 164. Guinea-Bissau |
| 38. Qatar | 80. Jamaica | 123. Solomon Islands | 165. Mozambique |
| 39. Bahrain | 81. Tunisia | 124. Cambodia | 166. Burundi |
| 40. Portugal | 82. Jordan | 125. Pakistan | 167. Niger |
| 41. Poland | 83. Turkey | 126. Congo | 168. Congo (Democratic Republic of the) |
| 42. Barbados | 84. Algeria 85. Tonga | 127. São Tomé and Príncipe | 169. Zimbabwe |
Source: UNDP, “Human Development Index (HDI)—2010 Rankings,” Human Development Reports, accessed January 6, 2011, http://hdr.undp.org/en/statistics.
In 1995, the UNDP introduced two new measures of human development that highlight the status of women in each society.
The first, gender-related development index (GDI), measures achievement in the same basic capabilities as the HDI does, but takes note of inequality in achievement between women and men. The methodology used imposes a penalty for inequality, such that the GDI falls when the achievement levels of both women and men in a country go down or when the disparity between their achievements increases. The greater the gender disparity in basic capabilities, the lower a country’s GDI compared with its HDI. The GDI is simply the HDI discounted, or adjusted downwards, for gender inequality.
The second measure, gender empowerment measure (GEM), is a measure of agency. It evaluates progress in advancing women’s standing in political and economic forums. It examines the extent to which women and men are able to actively participate in economic and political life and take part in decision making. While the GDI focuses on expansion of capabilities, the GEM is concerned with the use of those capabilities to take advantage of the opportunities of life.6
In 1997, UNDP added a further measure—the human poverty index (HPI).
If human development is about enlarging choices, poverty means that opportunities and choices most basic to human development are denied. Thus a person is not free to lead a long, healthy, and creative life and is denied access to a decent standard of living, freedom, dignity, self-respect and the respect of others. From a human development perspective, poverty means more than the lack of what is necessary for material well-being.
For policy-makers, the poverty of choices and opportunities is often more relevant than the poverty of income. The poverty of choices focuses on the causes of poverty and leads directly to strategies of empowerment and other actions to enhance opportunities for everyone. Recognizing the poverty of choices and opportunities implies that poverty must be addressed in all its dimensions, not income alone.7
Rather than measure poverty by income, the HPI is a composite index that uses indicators of the most basic dimensions of deprivation: a short life (longevity), a lack of basic education (knowledge), and a lack of access to public and private resources (decent standard of living). There are two different HPIs—one for developing countries (HPI-1) and another for a group of select high-income OECD (Organization for Economic and Development) countries (HPI-2), which better reflects the socioeconomic differences between the two groups. HPI-2 also includes a fourth indicator that measures social exclusion as represented by the rate of long-term unemployment.8
Why Does All This Matter to Global Marketing?
So, the richest countries—like Liechtenstein, Qatar, and Luxembourg—may not always have big local markets or, in contrast, the poorest countries may have the largest local market as determined by the size of the local population. Savvy business managers need to compare and contrast a number of different classifications, statistics, and indicators before they can interpret the strength, depth, and extent of a local market opportunity for their particular industry and company.
Advice to Students
The major classifications used by analysts are evolving. The primary criteria for determining the stage of development may change within a decade as demonstrated with the addition of the gender and poverty indices. In addition, with every global crisis or event, there’s a tendency to add more acronyms and statistics into the mix. Savvy global managers have to sort through these to determine what’s relevant to their industry and their business objectives in one or more countries. For example, in the fall of 2010, after two years of global financial crisis, global investors started using a new acronym to describe the changing economic fortunes among countries: HIICs, or heavily indebted industrialized countries. These countries include the United States, the United Kingdom, and Japan. “‘Developed markets are basically behaving like emerging markets,’ says HSBC’s Richard Yetsenga. ‘And emerging markets are quickly becoming more developed.’”9 Investors are pulling money from the developed countries and into the BRIC countries (i.e., Brazil, Russia, India, and China), which are “‘where the population growth is, where the raw materials are, and where the economic growth is,’ says Michael Penn, global equity strategist at Bank of America Merrill Lynch.”10 The key here is to understand that classifications—just like countries and international business—are constantly evolving.
Rather than being overwhelmed by the evolving data, it’s critical to understand why the changes are occurring, what attitudes and perceptions are shifting, and if they are supported by real, verifiable data. In the above example of HIICs, investors from the major economies are likely motivated by quick gains on stock prices and the prevailing perception that emerging markets offer companies the best growth prospects. But as a businessperson, the timeline for your company would be in years, not months; so it’s important to evaluate information based on your company’s goals rather than relying on the media, investment markets, or other singularly focused industry professionals.
To truly monitor the global business arena and select prospective countries, you need to follow the news, trends, and available information for a period of time. Over time, savvy global managers develop a geographic, industrial, or product expertise—or some combination. Those who become experts on a specific country spend a great deal of time in the country, sometimes learn the language, and almost always develop an understanding of the country’s political, economic, and social history as well as its culture and evolution. They gain a deeper knowledge of more than just the country’s current business environment. In the business world, these folks are affectionately called “old hands”—as in he is an “old China hand” or an “old Indonesia hand.” This is a reflection of how seasoned or experienced a person is with a country.
Key Takeaways
- There are some classifications that are commonly used to define a stage of a country’s development. The GDP is the value of all the goods and services produced by a country in a single year. The income per person, a better indicator of the strength of the local economy and the market opportunity for a new consumer product, is the nominal per capita GDP—the GDP divided by the population of the country. Finally, to compare production and income across countries, economists adjust this number to reflect the different costs of living in specific countries. PPP adjusts the exchange rate between countries to ensure that a good is purchased for the same price in the same currency.
- The HDI measures people’s satisfaction in three key areas: (1) long and healthy life in terms of life expectancy; (2) access to quality education equally; and (3) a decent standard of living in the form of income. Health is measured by life expectancyat birth; knowledge is measured by a combination of the adult literacy rate and the combined primary, secondary, and tertiary gross enrollment ratio; and standard of living by (income as measured by) per capita GDP.
- Standards are constantly evolving to meet changing global scenarios; for instance, in 1997, the UNDP added the HPI to factor in the denial of basic opportunities and choices to those who live in poverty. It’s critical to understand whythe changes are occurring, what attitudes and perceptions are shifting, and if they are supported by real, verifiable data.